This page describes how to perform some basic sound processing functions in Python. We’ll be using the pylab interface, which gives access to numpy and matplotlib, both these packages need to be installed. We’ll also use scipy to import wav files.
We’ll begin by importing the necessary packages, assuming they’ve been already installed correctly
from pylab import*
from scipy.io import wavfile
Next we read in a wav file. You can download it here 440_sine.wav, it contains a complex tone with a 440 Hz fundamental frequency (F0) plus noise.
sampFreq, snd = wavfile.read('440_sine.wav')
the scipy.io.wavfile.read function reads wav files as int16 (for 16-bit wavs) or int32 (for 32-bit wavs), 24-bit wav files are not supported. We can check the type of the sound as follows:
>>> snd.dtype
dtype('int16')
this means that the sound pressure values are mapped to integer values that can range from -2^15 to (2^15)-1. We can convert our sound array to floating point values ranging from -1 to 1 as follows:
snd = snd / (2.**15)
The wav file has two channels and 5292 sample points
>>> snd.shape
(5292, 2)
considering the sampling rate (sampFreq = 44110) this corresponds to a duration of 120 ms
>>> 5292 / sampFreq
0.12
we’ll select and work with only one of the channels from now onwards
s1 = snd[:,0]
Unfortunately there is not an immediate way of listening to the sound directly from python. However, if you’re interested in having sound playback from python check out pyalsaaudio (only Linux) or PyAudio.
Plotting the Tone
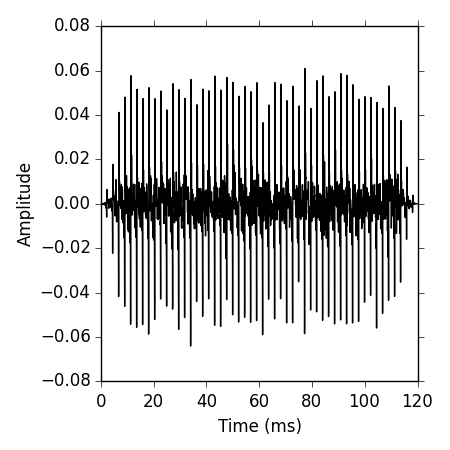
A time representation of the sound can be obtained by plotting the pressure values against the time axis. However, we need to create an array containing the time points first:
timeArray = arange(0, 5292, 1)
timeArray = timeArray / sampFreq
timeArray = timeArray * 1000  #scale to milliseconds
now we can plot the tone
plot(timeArray, s1, color='k')
ylabel('Amplitude')
xlabel('Time (ms)')
Plotting the Frequency Content
Another useful graphical representation is that of the frequency content, or spectrum of the tone. We can obtain the frequency spectrum of the sound using the fft function, that implements a Fast Fourier Transform algorithm. We’ll follow closely the technical document available here to obtain the power spectrum of our sound.
n = len(s1)
p = fft(s1) # take the fourier transform
notice that compared to the technical document, we didn’t specify the number of points on which to take the fft, by default then the fft is computed on the number of points of the signal n. Since we’re not using a power of two the computation will be a bit slower, but for signals of this duration this is negligible.
nUniquePts = int(ceil((n+1)/2.0))
p = p[0:nUniquePts]
p = abs(p)
the fourier transform of the tone returned by the fft function contains both magnitude and phase information and is given in a complex representation (i.e. returns complex numbers). By taking the absolute value of the fourier transform we get the information about the magnitude of the frequency components.
p = p / float(n) # scale by the number of points so that
# the magnitude does not depend on the length
# of the signal or on its sampling frequency
p = p**2 # square it to get the power
# multiply by two (see technical document for details)
# odd nfft excludes Nyquist point
if n % 2 > 0: # we've got odd number of points fft
p[1:len(p)] = p[1:len(p)] * 2
else:
p[1:len(p) -1] = p[1:len(p) - 1] * 2 # we've got even number of points fft
freqArray = arange(0, nUniquePts, 1.0) * (sampFreq / n);
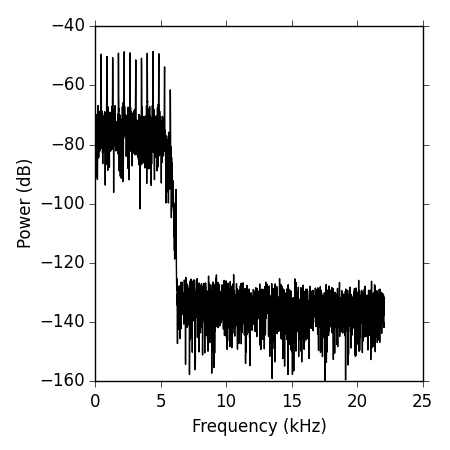
plot(freqArray/1000, 10*log10(p), color='k')
xlabel('Frequency (kHz)')
ylabel('Power (dB)')
The resulting plot can bee seen below, notice that we’re plotting the power in decibels by taking 10*log10(p), we’re also scaling the frequency array to kilohertz by dividing it by 1000.
To confirm that the value we have computed is indeed the power of the signal, we’ll also compute the root mean square (rms) of the signal. Loosely speaking the rms can be seen as a measure of the amplitude of a waveform. If you just took the average amplitude of a sinusoidal signal oscillating around zero, it would be zero since the negative parts would cancel out the positive parts. To get around this problem you can square the amplitude values before averaging, and then take the square root (notice that squaring also gives more weight to the extreme amplitude values):
>>> rms_val = sqrt(mean(s1**2))
>>> rms_val
0.013828411352103357
since the rms is equal to the square root of the overall power of the signal, summing the power values calculated previously with the fft over all frequencies and taking the square root of this sum should give a very similar value
>>> sqrt(sum(p))
0.01382841135210338
References
- Hartmann, W. M. (1997), Signals, Sound, and Sensation. New York: AIP Press
- Plack, C.J. (2005). The Sense of Hearing. New Jersey: Lawrence Erlbaum Associates.
- The MathWorks support. Technical notes 1702, available: https://web.archive.org/web/20120615002031/http://www.mathworks.com/support/tech-notes/1700/1702.html
Where ist the 440Hz in that spectrum??
It’s a harmonic complex tone with a missing fundamental frequency. The fundamental frequency is not in the spectrum, but its harmonics (multiples of 440 are). Said this, I just realized that the fundamental frequency of that tone is not 440, it’s actually 405, so you should find multiples of 405 in the spectrum. I’ll fix the error.
I’ve updated the post, now the tone really has a fundamental frequency of 440 Hz, and contains all harmonics (including the F0 up to 5000 Hz).
I just wanted to read a wav file.But I am getting valueerror.
Code->sampFreq, snd = wavfile.read(‘/home/xyz/Downloads/1234-Get-On-The-Dance-Floor.wav’)
ValueError Traceback (most recent call last)
in ()
—-> 1 sampFreq, snd = wavfile.read(‘/home/xyz/Downloads/1234-Get-On-The-Dance-Floor.wav’)
/home/xyz/anaconda2/lib/python2.7/site-packages/scipy/io/wavfile.pyc in read(filename, mmap)
256 raise ValueError(“No fmt chunk before data”)
257 data = _read_data_chunk(fid, format_tag, channels, bit_depth,
–> 258 is_big_endian, mmap)
259 elif chunk_id == b’LIST’:
260 # Someday this could be handled properly but for now skip it
/home/xyz/anaconda2/lib/python2.7/site-packages/scipy/io/wavfile.pyc in _read_data_chunk(fid, format_tag, channels, bit_depth, is_big_endian, mmap)
135
136 if channels > 1:
–> 137 data = data.reshape(-1, channels)
138 return data
139
ValueError: total size of new array must be unchanged
Hi pranav,
there are several different variations of the WAV file format and the ‘scipy.io.wavfile’ module is not able to handle all of them. I suspect that’s the issue with your WAV file. I suggest you try importing it into audacity, and then exporting it again as a WAV file from audacity. generally I’ve been able to read WAV files exported by audacity using the ‘scipy.io.wavfile’ module.